Armada Debug Shell
The Armada Debug Shell is a read-only, browser-based kubectl session scoped to a deployed application's namespace. Use it to diagnose a misbehaving application from inside the cluster — inspect pods, tail logs, describe deployments, and see what Kubernetes is actually doing — without needing your own kubeconfig or cluster access.
kubectl debug-shell (Krew plugin)This page covers the Armada Debug Shell, the browser-based kubectl session launched from Atlas. It is different from the Krew debug-shell plugin mentioned in Recommended kubectl Plugins, which is a local kubectl extension for ephemeral debug containers. Use this doc for the Atlas feature; use the Krew plugin only if you're running kubectl locally against your own kubeconfig.
When to use it
- Your application is behaving unexpectedly and you want to look at pods, logs, or Kubernetes events.
- You want to verify the config a Helm release actually landed with — ConfigMaps, mounted volumes, environment variables the pods received.
- You need to check whether resources scheduled correctly (HPA scaled, PVC bound, Deployment ready).
- You need to inspect why a rollout is stuck or a pod is crash-looping.
When NOT to use it
- You need to change something. The shell is read-only. Use your normal deployment tooling to apply changes.
- You need to
execinto a container. Blocked by design. If you need to interact with a running process, that's a different pattern (developer-mode deployments, localkubectl debugagainst your own kubeconfig). - You need to read secret values. Also blocked. If you suspect a secret is misconfigured, rotate it via Application Secrets Management and redeploy.
Prerequisites
- A deployed application instance. The Debug Shell attaches to an existing instance — it does not create workloads.
- A role that exposes the Debug session action. The button appears in the instance's actions panel for users with the operational role granted on the target instance. If the button is not visible, your role does not currently permit debug sessions on that instance — contact your Armada admin.
Launching a debug session
The Debug Shell is available in all environments from Atlas. Locate your deployed application instance and open its actions panel.
1. Start a debug session
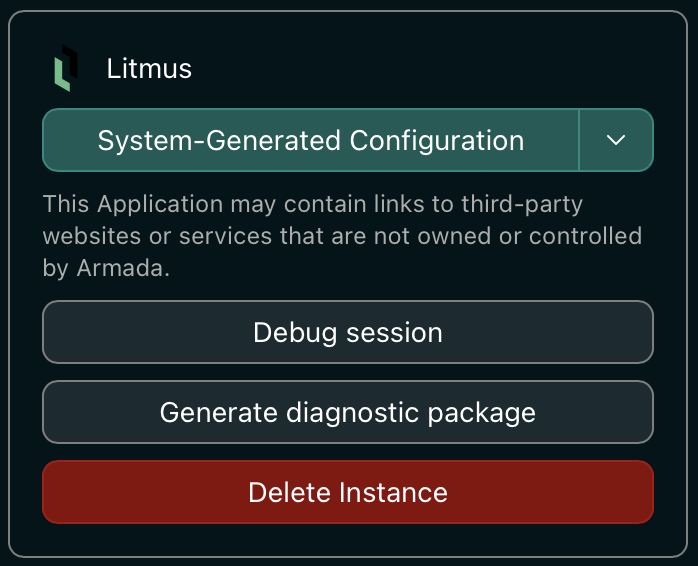
From the application instance's actions panel, click Debug session.
A confirmation modal appears with a summary of what the session does and its lifetime. The Session lifecycle section below has the full TTL details; the actual TTL for your session is displayed in the shell's welcome banner once it's running.
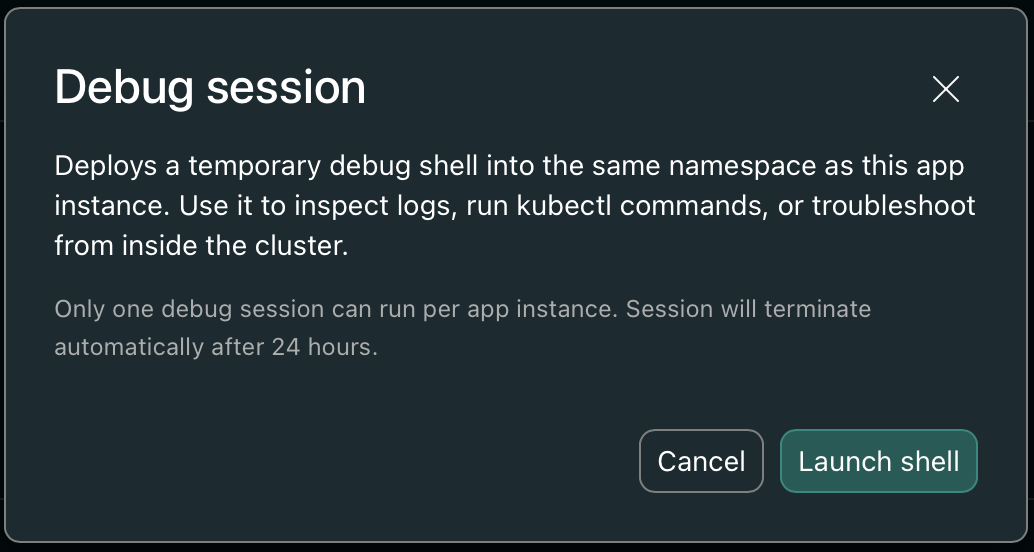
Click Launch shell.
2. Wait for provisioning
The shell is deployed as its own pod in the target's namespace with read-only RBAC. Provisioning usually takes 15–30 seconds.
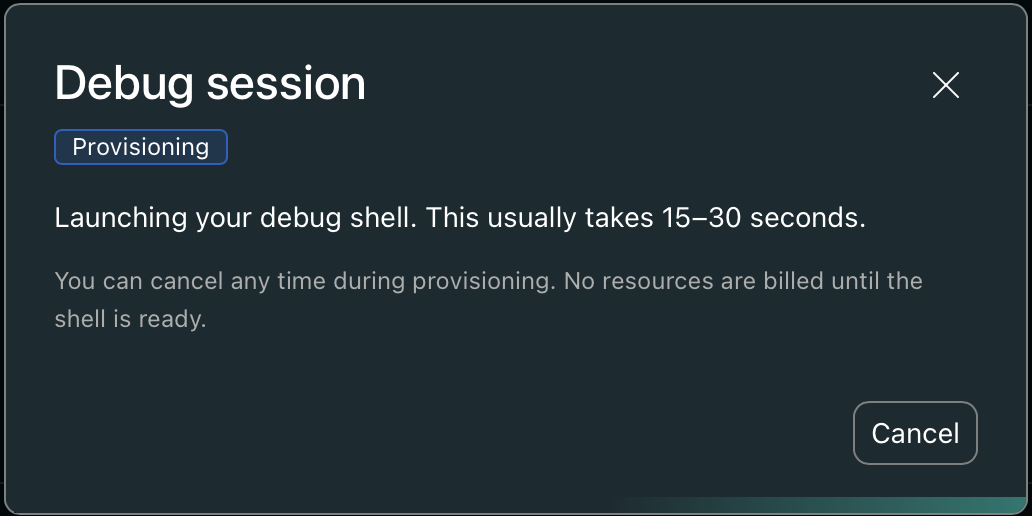
You can cancel during provisioning if you change your mind. No cluster resources are consumed until the shell reaches Active.
3. Connect
When the state flips to Active, click Connect to open the shell in a new browser tab.
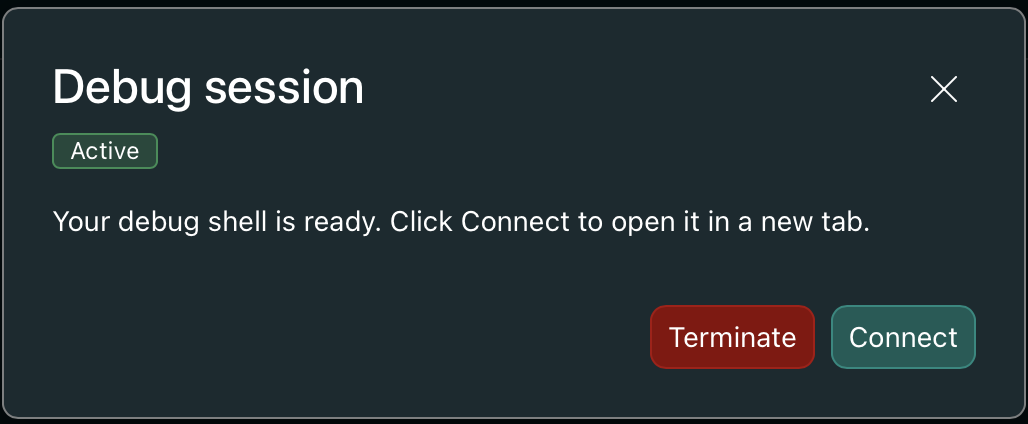
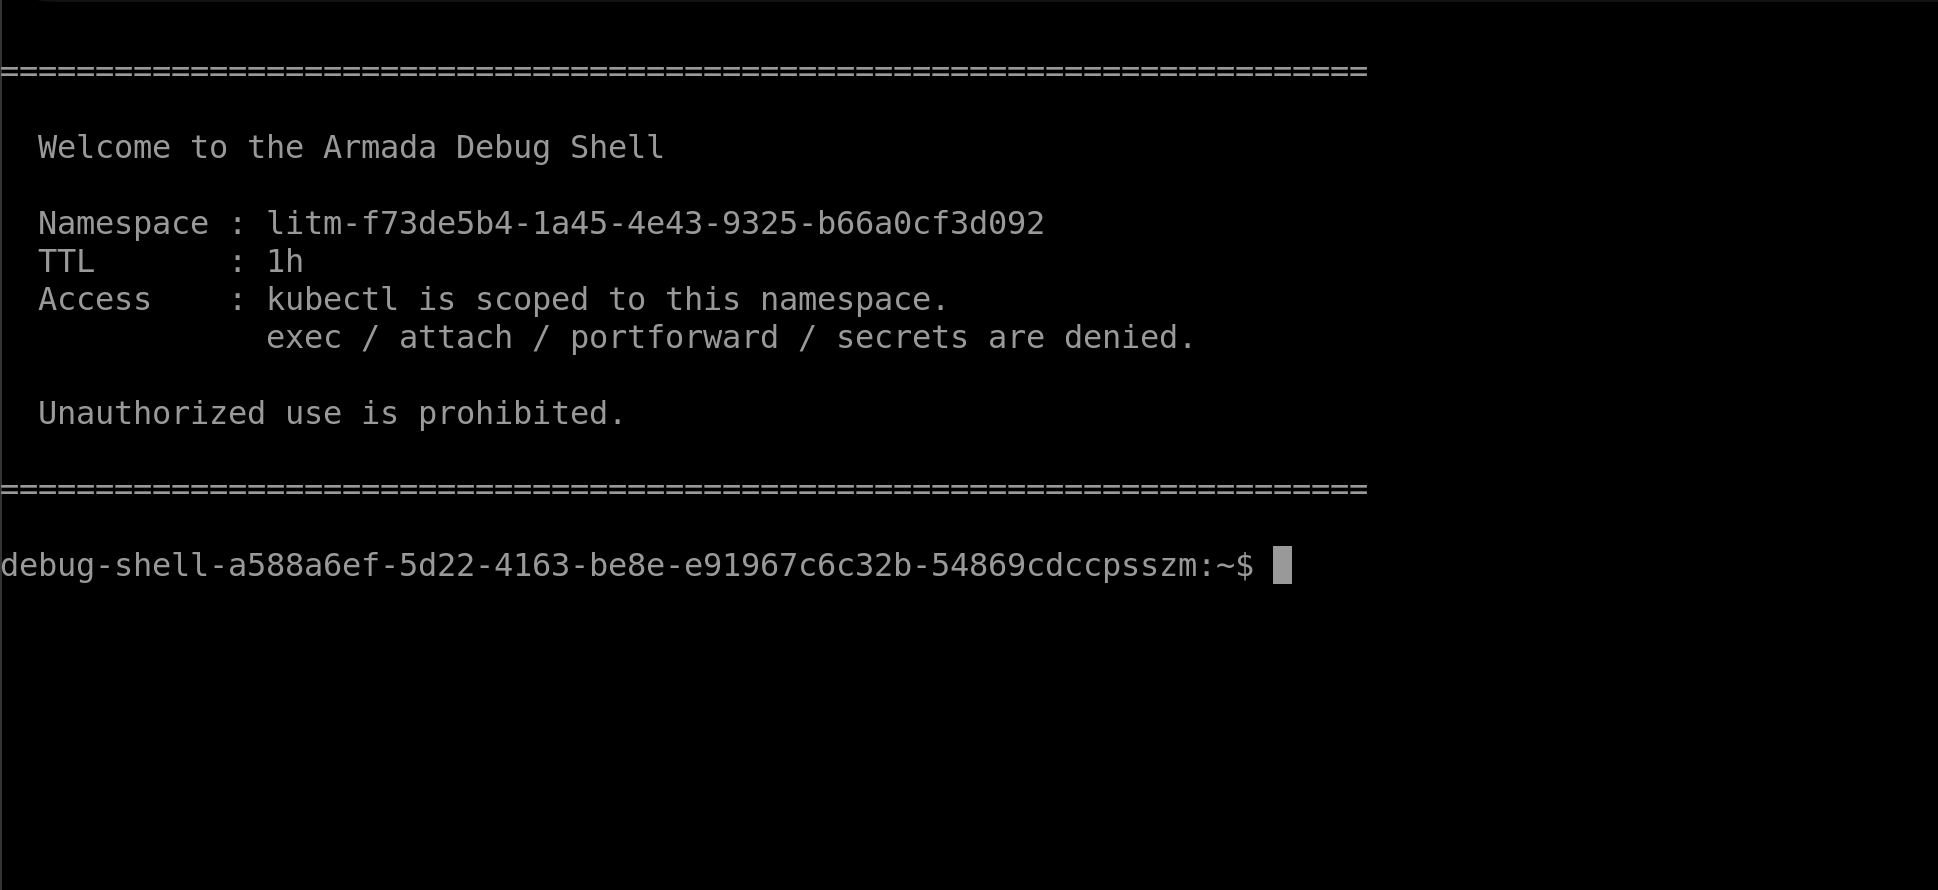
The shell opens with a welcome banner showing the target namespace, TTL, and access constraints. You're at a shell prompt with kubectl on PATH (alias k).
4. Reconnecting
The shell session persists until you explicitly Terminate it or its TTL expires. If you close the shell tab, you can reopen it by clicking Debug session again from the same application instance — Connect opens a fresh browser tab against the still-running shell.
What the session can access
The shell has read-only, namespace-scoped RBAC. Allowed resources and verbs:
| Resource | Verbs | API group |
|---|---|---|
| Pods, Services, ConfigMaps, Endpoints, PVCs, Events, ReplicationControllers, ServiceAccounts | get, list, watch | core |
| Pod logs | get, list — includes --previous for restarted containers | core |
| Deployments, ReplicaSets, StatefulSets, DaemonSets | get, list, watch | apps |
| Jobs, CronJobs | get, list, watch | batch |
| Ingresses, NetworkPolicies | get, list, watch | networking.k8s.io |
| Gateways, HTTPRoutes, GRPCRoutes, ReferenceGrants | get, list, watch | gateway.networking.k8s.io |
| HorizontalPodAutoscalers | get, list, watch | autoscaling |
What the session cannot access
Enforced both at the RBAC layer and at an in-pod proxy filter (belt-and-suspenders):
- Secrets — no
get/list/watchonsecrets/*. Metadata (existence, key names) still visible via referenced resources (k describe pod), but never values. - exec / attach / port-forward — pod subresources denied. This is a diagnostic session, not an interactive one.
- Other namespaces — the proxy's allow-list is scoped to your app's namespace. Queries against any other namespace fail.
- Write operations — no
create/update/patch/deleteon any resource. This is a read-only session. - Metrics (
kubectl top) — themetrics.k8s.ioAPI group is not exposed. Usek describe hpa <name>for scaling signals; the HPA'sMetricssection shows current-vs-target values.
Session lifecycle
| State | Meaning |
|---|---|
| Provisioning | Shell pod is deploying (~15–30s). Cancelable. |
| Active | Shell is ready to Connect. Persists until Terminate or TTL. |
| Terminated | Shell was explicitly ended. New session can be started. |
Only one active session per application instance. If you click Debug session again while one is Active, the Atlas modal opens the existing session — clicking Connect reopens a browser tab against the running shell. Terminate the current session before starting a fresh one.
TTL and cleanup
- Sessions auto-terminate after their TTL. In production the TTL is 24 hours; in sandbox environments it is shorter (currently 1 hour). The actual TTL for your session is shown in the shell's welcome banner.
- Click Terminate in the Atlas modal to end the session early — freeing the compute footprint immediately rather than waiting for TTL.
- If the target application instance is deleted, the shell is torn down with it automatically (no orphaned shell after the target is gone).
Audit and attribution
Every debug shell pod carries a label app.armada.ai/user=<your-username> that surfaces in:
- Kubernetes audit logs
- Platform network audit trails (attributed to your session)
- Atlas session records
Assume every command you run in the shell is logged. This is a shared platform; the audit trail exists for operations, security review, and post-incident forensics.
Common debugging workflows
For a broader debugging methodology see Debugging Guides. The recipes below are the ones you can run entirely from the Debug Shell.
Why is my pod not ready?
k get pods
k describe pod <name>
k logs <name>
k logs <name> --previous     # if a container crashed
k get events --sort-by=.lastTimestamp
Did my ConfigMap update land?
k get cm
k get cm <name> -o yaml
k rollout status deployment/<name>
Is my service pointing at the right pods?
k get svc <name> -o yaml
k get endpoints <name>
k get pods -l app=<label> --show-labels
Why isn't my HPA scaling?
k get hpa
k describe hpa <name>         # Metrics section shows current vs. target values
kubectl top is not available in the Debug Shell — the metrics.k8s.io API group is not exposed. Use k describe hpa for scaling signals.
Why won't my ingress route work?
k get ingress
k describe ingress <name>
k get httproute              # if using Gateway API
k describe httproute <name>
Which secrets does my app reference?
Values cannot be read from the Debug Shell. But you can see which secrets are wired to your pods via the pod spec:
k describe pod <name>         # shows envFrom / secretKeyRef entries
k describe deployment <name>  # shows the same at the deployment level
To rotate a secret value, use the Application Secrets Management flow. Redeploy the application instance to pick up the new value.
Troubleshooting the shell itself
Session stuck in Provisioning for more than 2 minutes
- First launch is slow (~15–30s). If it's been more than 2 minutes, check Atlas for an error notification, then cancel and retry.
- If the retry also stalls, the platform may be degraded — wait a minute and try again, or contact your Armada admin.
kubectl command returns Forbidden
Expected on: secrets/*, pods/exec, pods/attach, metrics.k8s.io, and cross-namespace queries. Not a bug — see What the session cannot access.
Session disconnected mid-work
- TTL may have expired. Start a new session (see Session lifecycle for the one-session-per-instance rule).
- If the browser tab went stale but the session's TTL hasn't hit, click Debug session → Connect to reopen against the same active shell.
Related documentation
- Debugging Guides — broader diagnostic methodology; all
kubectlrecipes work from the Debug Shell - Common Issues & Solutions
- Application Secrets Management — rotate secret values (Debug Shell can't read them)
- Error Code Reference
- Recommended kubectl Plugins — different
debug-shell(Krew plugin), see disambiguation callout at top of this page